
Fatty acids are the group of lipids most commonly analyzed by GLC. This method is applicable to biological samples containing compounds with chain length in the range C14 to C24.
For cyclic fatty acids, see below.
For trans fatty acids, see another page.
GLC analysis of fatty acids is performed following their conversion to apolar, methyl ester derivatives. Columns with polar phases are used, as polyethylene glycol stationary phase (Carbowax), to coat capillary column. The majority of commercially available columns are coated with phases bonded or immobilized on the silica column wall. This technology leads to a great durability with a strong thermal stability.
For further information on theory and applications of GLC, see specialized monography (Jennings W “Analytical gas chromatography”, Acad Press, 1987).
When samples contain volatile compounds, a solventless introduction should be adopted (Burger BV et al. J Chromatogr 1990, 518, 207). Two methods of derivatization have been proposed for short-chain fatty acids, benzylation and ter-butyldimethylsilylation. The first mode has the advantage that the isolation prior to derivatization is accurate and very reliable (Monseur X et al., J High Resol Chromatogr 1981, 4, 49). The second provides a complete characterization of the fatty acids by mass spectroscopy (Kim K et al., J Chromatogr 1989, 468, 289; Ghoos Y et al., Anal Chim Acta 1991, 247, 223). Alternatively, short-chain fatty acids may be analyzed directly after water extraction before a direct injection procedure on a FFAP capillary column (Zhao G et al., Biomed Chromatogr 2006, 20, 674).
Analytical conditions must be adapted from published values to obtain reliable and precise results. The temperature gradient program is the main parameter to be modified according to the nature of the column and the complexity of the fatty acid mixture.
The identification of a peak can be made from its retention time but must be confirmed by other investigations such as TLC mobility, column fractionation or GC-MS. In practice, it is convenient to work not with retention time which is temperature and gas flow rate dependent, but with retention time relative to that of a suitable standard (stearic acid present in all samples is the most convenient). The logarithm of the relative retention time and the number of carbon atoms is linearly related and may be of some help to identify unknown fatty acids. A plot of these parameters with homologous series of saturates, monoenes, dienes, trienes, etc. gives a series of parallel lines. Alternatively, the identification of FAME is possible using the concept of the equivalent chain-length (ECL), by expressing their elution positions relative to those of known straight-chain saturated FAME. It must be remembered that the identification of fatty acids according to their equivalent chain-length is better done when isothermic conditions are observed. Details for the calculation of ECL and tables for a large number of FAME are given in specialized reports (Ackman RG Prog Chem Fats and other Lipids 1972, 12, 165; Christie WW Lipid analysis, Pergamon Press, 1982). An improvement of this approach based on the application of different temperature and pressure programs on a single capillary column was proposed (Mjos SA, J Chromatogr A 2004, 1061, 201). Fast analysis by gas-liquid chromatography on short and highly polar fast columns has been shown to give rapid and precise results even with biological samples with complex fatty acid compositions such as milk (Destaillats F et al., J Chromatogr A 2007, 1169, 175). A comparison of commercially-available high-resolution columns has been given, testing different column temperature and carrier gas linear velocities (Shibahara A et al., Lipid Technol 2008, 20, 88).
Only the principle of this determination is recalled below (as an example we restrict the demonstration for peaks situated between palmitic and stearic acids): if t16:0 is the retention time of palmitic acid and t18:0 is the retention time of stearic acid and ti the retention time of the unknown peak, the ECL value of this peak is calculated as : 100 x [[(18-16) x (log ti – log t16:0)/(log t18:0 – log t16:0)] + 16].
An efficient method for the identification of fatty acid methyl esters based on the analysis of shifts in ECL on a single capillary column was described by Mjos SA (J Chromatogr A 2003, 1015, 151). Various temperature and pressure programs are applied and the shifts in the ECL values are mathematically analyzed. Thus, the chain length, the number of double bonds, and the double bond positions can be determined with high accuracy. The use of retention indices for identification of 130 fatty acid methyl esters has been reported using a standard non-polar polydimethylsoloxane stationary phases (Farkas O et al., J Chromatogr A 2008, 1198-1199, 188).
A fatty acid methyl ester database using high resolution capillary gas chromatography and mass spectrometry has been established, it contains retention time and mass spectral information of about 100 fatty acids (Bicalho B et al., J chromatogr A, 2008, 1211, 120). A database of chromatographic properties (and mass spectra) obtained using two different analytical columns have been reported for more than 100 fatty acid methyl esters (Wasta Z et al., J Chromatogr a 2013, 1299, 94).
For routine works, it is convenient to use commercially available standard mixtures of FAME (from Sigma, Matreya, Nu-Chek-Prep, Larodan …) but natural extracts from animal products are also useful (fish oil, vegetal oils, bovine or rat testes, bovine or rat brain) since their fatty acid compositions were frequently reported. Reference oil samples from animal and vegetal origin may be ordered from the American Oil Chemical Society which gives also analysis sheets of results. As part of a collaborative work with several official organisms, the National Institute of Standards and Technology (USA) has developed Standard Reference Material (SRM) 3274 Botanical Oils containing omega-3 and omega-6 fatty acids and SRM 3275 containing these fatty acids in fish oil (Schantz MM et al., Anal Bioanal Chem 2013, 405, 4531). These SRMs will complement other reference materials currently available with mass fractions for similar analytes and are part of a series of SRMs being developed for dietary supplements.
A general method was accurately described for the analysis of milk fat with details on peak quantification (Collomb M et al. Mitt Lebensm Hyg 2000, 91, 306).
An automated analysis of fatty acid methyl esters using a XYZ robotic autosampler has been described (de Koning S et al., J Chromatogr A 2001, 922, 391). After preparing manually a solution of fatty acids, the autosampler is used to add reagent (sodium methylate), agitate, and finally inject into the gas chromatograph. That procedure takes about 15 min before analysis of the samples.
The separation of fatty acids of the palmitoleate series (n-7) from the n-6 series may be improved in using a specific capillary column coated with cyanopropyl polysiloxane as it was proposed for the study of liver fatty acids associated with fat deficiency (Wolff RL et al., Lipids 1990, 25, 859).
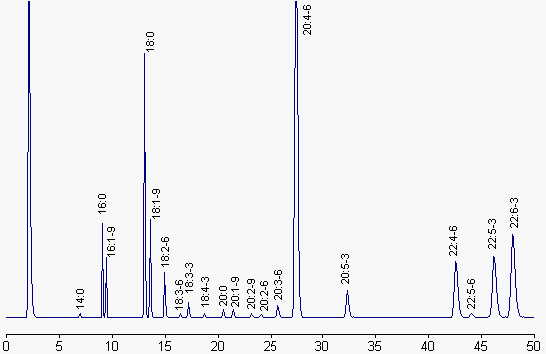
We give below a chromatogram corresponding to the fatty acid profile of liver phospholipids.
Fatty acids are represented by their number of carbon atoms : number of double bonds – series (n-x).
Column: Carbowax phase (Alltech), 30 m x 0.25 mm ID, 0.25 µm film thickness.
Temperature programming: 100°C for 2 min, 195°C for 33 min and 220°C up to the end. Temperature rate changes: 40°C/min. Injector: 200°C, detector: 250°C, helium is the carrier gas.
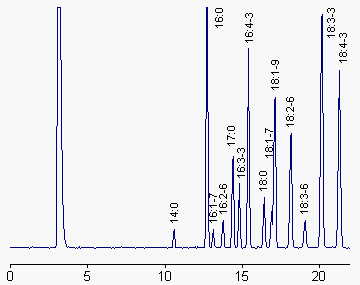
We give below a chromatogram corresponding to the fatty acid profile of total lipids from a green algae (Enteromorpha sp). Notice the presence of 17:0 as an internal standard, and the three unusual plant fatty acids: 16:2n-6, 16:3n-3 and 16:4n-3.
Quantitation and expression of results
The lipidologist must be aware of the non exact linearity of the detector response to the fatty acid mass. The responses of the detector used should be checked with a calibrated standard mixture. This correction is more important in studies concerning highly unsaturated fatty acids.
As it is difficult to obtain and maintain high purity standards of unsaturated fatty acids, an alternative is to use the correction factors previously determined relatively to methyl stearate (Bannon CD et al., JAOCS 1986, 63, 105). Thus, these authors have estimated that the means of response factors relative to C18:0 are 0.996 for monoene, 0.986 for diene, 0.981 for triene, 0.959 for tetraene, and 0.941 for hexaene fatty acids. A value of 0.950 may be estimated by interpolation for pentaene fatty acids.
It has been shown that the use of C23:0 as internal standard, as outlined in official methods for marine oils (AOCS official methods), can lead to systematic overestimation of n-3 long-chain fatty acids (Schreiner M, J Chromatogr A 2005, 1095, 126). To improve the accuracy and precision of fatty acids analysis, the author proposed to select the appropriate internal standard (C19:0 for unsaturated C20 fatty acids and C21.0 for unsaturated C22 fatty acids). This will result in relative standard deviations for consecutive injections of less than 0.25% and systematic errors will usually be beyond 1% (errors of more than 5% must be accepted with C23:0 as internal standard).
Peak areas are now measured with an electronic integrator, this is the most accurate and convenient procedure. Nevertheless, the lipidologist must be aware of the limitations of his integrator and, the use of an adapted chromatographic software is highly recommended to verify the integration process.
Results are frequently expressed as weight percent (area normalization), this is currently used in nutrition works. In biochemical studies, as for membrane structure, results should be expressed on a molar percentage basis. This rule has been edicted by Hilditch TP in 1947 (The chemical constitution of natural fats, Chapman et Hall Ltd, 1947):
“The molar composition is frequently more informative than composition by weight in discussing the fats, because it expresses the relative number of molecules of each type of acid, or component glyceride, present in a fat. The difference in the two modes of expression becomes especially significant when fatty acids of widely different molecular weight are present in the same fat. Thus, for instance, the presence of 3 per cent. by weight of butyric acid in the mixed acids of butter fat really means that, out of every 100 mols. of fatty acids, about 10 mols. are butyric acid“.
One disadvantage of area normalization is error propagation : the strong interdependence of results. Thus, if one fatty acid is wrongly estimated (or omitted when unknown), the results for the other fatty acids are affected. To reduce quite all kinds of errors, the use of an internal standard (generally C17 or C19) is recommended. If measurement uncertainty shall be expressed according to the ISO or EURACHEM/CITAC “Guide Quantifying Uncertainty in Analytical Measurement”, the internal standard method must be adopted.
The official methods of the Association of Analytical Chemists and the American Oil Chemists’s Society provide clear guidelines for accurate quantification of long-chain fatty acids. Both sources stipulate the use of C23:0 (methyl tricosanoate) as internal standard and wax-type capillary columns are mandatory.
For marine oil concentrates, the method according to the European Pharmacopeia (2.4.29) must be chosen to enable precise measurements. It uses the determination of response factors for EPA and DHA relative to 23:0 to correct for losses during GC analysis (Scrimgeour C et al., Lipid technology 2017, 29, 71).
To help the calculation of data from peak areas we propose the use of an Excel sheet to automatically convert areas given on the chromatogram (after correction if necessary) into molar percentages.
Download the
Fatty acids (column B) are ranked according to their elution order on a carbowax capillary column (column A). Peak surfaces are entered in column D instead of the zero values. The weight of the internal standard (µg C17:0) is entered in D62 and its corresponding surface in D63. The molar percentage of each fatty acid is quoted in column C. Several important constants are also given such as the sum of saturated (S. Sat), unsaturated (S. Unsat), monoene (MUFA) and polyene (PUFA) fatty acids. DB index: number of double bonds for 100 moles fatty acids. Perox. Index: peroxidizability index. The total amount of fatty acids in the analyzed sample is given in C59 (µg) and in C61 (nmol) and their average molecular weight is given in C60. This last value enables to calculate the average molecular weight of the original lipid before methylation.
When known chromatographic fractions are analyzed, the weight of fatty acids may be used to calculate the weight of the initial acylated lipid present in the fraction: this weight equals the number of µmol of lipid (estimated from the amount of nmol fatty acids) multiplied by its average molecular weight. This last value is estimated for each kind of lipid from the average fatty acid molecular weight (MW, given in the Excel sheet) with the formula given below.
|
LIPID |
Formula |
| Monoacylglycerol |
MW + 64 |
| Diacylglycerol |
2 x MW + 56 |
| Triacylglycerol |
3 x MW + 38 |
| Cholesterol ester |
MW + 369 |
| Phosphatidylcholine |
2 x MW + 224 |
| Phosphatidylethanolamine |
2 x MW + 181 |
| Phosphatidic acid |
2 x MW + 138 |
| Phosphatidylserine |
2 x MW + 225 |
| Phosphatidylinositol |
2 x MW + 299 |
| Cardiolipin |
4 x MW + 332 |
| Sphingomyelin |
MW + 448 |
At the end of the process, the lines are ordered according to their increasing rank given in column A and columns B and C are copied in another presentation sheet.
An omega-3 index may be also calculated. This index was defined as the sum of EPA and DHA expressed as a molar percentage of the total fatty acids, classically in red blood cell membranes (Harris WS et al., Prev Med 2004, 39, 212). Among several advantages, its half-life is 4–6 times longer than serum or plasma EPA and DHA, and analogous to the measurement of HbA1c in red cells in patients with diabetes mellitus. Thus, it better reflects long-term exposure to these fatty acids than do serum and plasma because it is not influenced by the fasting or fed state.
Different approaches for converting fatty acid data in animal flesh as weight percent of total fatty acid or of total lipid content per 100 g edible portion fresh weight have been examined and discussed (Nowak V et al., Food Chemistry 2014, 153, 457).
The definitive identification of unsaturated fatty acids requires the determination of double bond position. That determination was accomplished by manual oxidation techniques using O3 or KMnO4 with subsequent analysis of products (Longmuir KJ et al., Anal Biochem 1987, 167, 213). More rapid and precise results were obtained using conversion of fatty acids into various esters with mass spectral analysis (Christie WW, Lipids 1998, 33, 343). An improved method was developed for that structural determination using acetonitrile as a chemical ionization reagent gas (Van Pelt CK et al., Anal Chem 1999, 71, 1981; Michaud AL et al., Anal Biochem 2002, 307, 348).
It must be noticed that a detection system based on electron impact mass spectrometry provides a means of qualitative characterization of FAME but has also quantitative performance which compares satisfactorily with that of detection using flame ionization detection (Dodds ED et al., Lipids 2005, 40, 419). A method using a coupling of gas chromatography and detection with electron ionization-mass spectrometry in the selected ion monitoring mode was proposed for the analysis of both major and minor fatty acid methyl esters (Thurnhofer S et al., J Agric Food Chem 2005, 53, 8896). The method was shown to be about 10-fold more sensitive than flame ionization detection and to be suited for identification of very low amounts of fatty acids.
More efficient methods are required when complex mixtures must be analyzed. As an example, fatty acids in milk are accurately determined if a two-dimensional gas chromatography is available (Vlaeminck B et al., Eur J Lipid Sci Technol 2007, 109, 757).
The GLC procedures for the analysis of cyclic fatty acids (cyclopentenyl, cyclopropane, cyclopropene) was extensively reviewed by Dobson G (Lipid analysis in oils and fats, Hamilton RJ Ed, Blackie Acad and Professional, London, 1998, p.136).
Devenez membre et participez au développement de la Lipidomique au XXIème siècle.
S'inscrire