ANALYSIS OF DIACYLGLYCEROLS
The determination of the amount and the fatty acid composition of diacylglycerols (DAG) in the µg range is easily made after TLC either without (for global analysis) or with borate impregnation (for discrimination between 1- and 2-DAG). The scraped spots are directly transmethylated with BF3/methanol after addition of an odd fatty acid (C17:0) as internal standard. The mass of DAG in the spot is calculated as 1.10 times the mass of fatty acids.
An evaluation of the total amount of diacylglycerols can also be made by the determination of glycerol after a saponification step.
Gas chromatography has also been used to determine DAG in fats and oils. A simple method based on solid phase extraction before chromatography has been developed for the determination of low levels of DAG in dairy products (Fagan P et al., J Chromatogr A 2004, 1054, 251). DAG were separated according to their carbon numbers but were also identified in each group.
DAG are universal cellular components engaged in the signaling of various activation factors (agonists) which modulate cell functions. They are found in tiny concentrations (µmolar range) and have various compositions owing to the two fatty acids in position 1 and 2 of glycerol. It is generally admitted that the 1,3-DAG are artifacts produced by isomerization of the 1,2- or 2,3-DAG. 1,2-DAG are also important intermediate compounds in the metabolism of phospholipids and triacylglycerols. The study of DAG must be made as soon as possible, immediately after the cell metabolism is stopped by cold, alcohol, acids…
DAG are easily isomerized and thus they are preferably transformed (derivatized) in detectable compounds in the lipid extract itself.
The determination of isomeric DAG in olive oils was proposed to detect the freshness of oils in correlation with the manufacturing practices and the sensory attributes (Gertz C et al., Eur J Lipid Sci Technol 2006, 108, 1066). The method is based on the isolation of DAG by silica gel chromatography followed by a separation of the isomers after silylation and gas chromatography.
Gas chromatographic retention indices of TMS derivatives of 11 species of DAG on a non-polar stationary phase has been reported (Isidorov VA et al., J Chromatogr A 2007, 1166, 207). The quantification of diacylglycerol species was successfully done using a positive mode electrospray ionization mass spectrometry without prior derivatization (Callender HL et al., Anal Chem 2007, 79, 263). Measurements of DAG in skeletal muscle extracts have been described using ionization mass spectrometry (Lee SY et al., Lipids 2013, 48, 287).
A review on the regio- and stereospecific analysis of diacylglycerols using mass spectrometry may be read for modern technologies (Kuksis A et al., Methods 2005, 36, 172). A novel and reliable chromatographic approach to analyze chiral diacylglycerols after transformation into carbamates has been described (Rodriguez JA et al., Anal Biochem 2008, 375, 196-208).
The analysis of DAG is the final part of the study of the phospholipid molecular species.
At a very low levels, 1,2-DAG are usually assayed by a radiochemical method in which 32P is incorporated into phosphatidic acid, using microbial DAG kinase. Here we describe a simple and reliable HPLC assay for the measurement of DAG with sensitivity similar to the radiochemical method.
Determination of free DAG amounts
Several procedures were described to derivatize DAG. Among others, with UV detection, Nakagawa et al (J Lipid Res 1983, 24, 1268) used acetic anhydride, Blank et al (J Chromatogr 1984, 298, 473) used benzoic anhydride and Kito et al (J Biochem 1985, 98, 327) used 3,5-dinitrobenzoyl chloride. To increase the sensitivity of the detection, we used a fluorescent tag (Naproxene) which allowed the quantification of the DAG pool and the study of DAG molecular species in the nmolar range (Rastegar et al, J Chromatogr 1990, 518, 157). A modification of this method was proposed to enabling the use commercial reagents (Previati et al Anal Biochem 1996, 233, 108).
Reagents:
Dry chloroform without ethanol (keep in a tightly closed vessel on previously dried sodium sulfate)
Solution of Naproxene (6-methoxy-a-methyl-2-naphthaleneacetic acid): 23 mg/ml chloroform
Solution of DCC (N,N-dicyclohexylcarbodiimide): 21 mg/ml chloroform
Solution of DMAP (4-dimethylaminopyridine): 12 mg/ml chloroform
Keep all solutions at -20°C
Procedure:
Derivatization
Dissolve the dry lipid extract (in a 2 ml Eppendorf tube of the best quality) in 100 µl chloroform and add 10 µl of naproxene solution, 10 µl of DCC solution and 10 µl of DMAP solution.
Keep the mixture 3 h at -20°C.
Evaporate under a nitrogen flux and dissolve in 20 µl chloroform. Add 2 ml hexane.
After vortexing, centrifuge 10 min at 14 000 rpm.
The hexane phase is transferred in a glass tube containing 5 ml of methanol/water (4/1).
Vortex 1 min and centrifuge 5 min. The upper phase is collected, evaporated and dissolved in 100 µl petroleum ether.
Purification by TLC
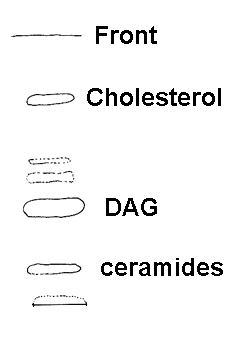
Derivatized DAG are purified by TLC on silica gel with petroleum ether/diethyl ether (75/25, v/v) as solvent system. A spot of a derivatized DAG standard run in parallel (1 or 2 µg) helps to delimit the unvisible spots of the experimental samples.

The figure shows the separation of a cellular extract where the spots of derivatized lipids are fluorescent after a primuline spray.
After spraying the plate with primuline, the fluorescent spots (under UV light) identified as derivatized DAG with the help of a standard are scraped and eluted two times with 2 ml of acetonitrile. The solvent is evaporated and the lipids are dissolved in a small amount of hexane/isopropanol (99/1, v/v) before HPLC.
Notice that ceramides are also derivatized and separated by TLC in the same system than that used for DAG.
The TLC purification is needed to remove all fluorescent contaminants which disturb the HPLC chomatogram.
HPLC separation
We use a 10 cm silica column (particle size: 3µm) with hexane/isopropanol (99.4/0.6, v/v) as mobile phase (1 ml/min). The fluorimetric detection was performed at the excitation wavelength of 230 nm and emission wavelength of 352 nm. Dioleoyl DAG was used to obtain a standard calibration curve (range: 10-100 ng).

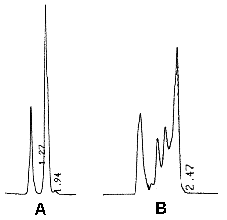
A: the second peak correspond to 20 ng of 18:1/18:1-DAG
B: the three last peaks correspond to about 23 ng of DAG coming from activated blood platelets. The peaks correspond to the various molecular species present in the platelet sample. The total DAG content is estimated by the measurement of the area of the three peaks and compared to a standard curve.
Determination of diradylglycerols obtained from phospholipids
As the study of the intact molecular species of phospholipids still remains difficult, the best approach is to isolate the diacylglycerol backbone by lipase hydrolysis.
When diradylglycerols are produced from phospholipids by phospholipase C hydrolysis, it becomes necessary to separate the three sub-classes: the alkenylacyl-, alkylacyl- and diacylglycerol.
These 3 groups are mainly encountered in the study of phosphatidylcholine and phosphatidylethanolamine.
After lipase hydrolysis, diradylglycerols are rapidly derivatized with Naproxene as previously described. Then, the three sub-classes are separated by TLC on slica gel plates developed in petroleum ether/diethyl ether (75/25, v/v).
After a primuline spray the three sub-classes are viewed under UV light. The Rf of derivatized alkenyl-, alkylacyl- and diacyl-DAG are 0.82, 0.75 and 0.67, respectively.
Assays with commercial samples of phosphatidylcholine and phosphatidylethanolamine from bovine brain help to localize the spots corresponding to the different diradylglycerols: the alkenylacylglycerol are present only in the phosphatidylethanolamine sample, the alkylacylglycerols being smaller spots with lower Rf between the former and the diacylglycerols.
The fluorescent spots are scraped and eluted 2 times by 2 ml acetonitrile. The solvent is evaporated and the fractions are dissolved in chloroform and quantified by UV spectrophotometry (230 nm) or fluorimetry (excitation: 230 nm, emission: 352 nm).
The different diradylglycerols can be also separated and quantified by HPLC on normal phase.
The same derivatization procedure is used for the analysis of the molecular species of free diradylglycerols or of phospholipids after their hydrolysis with phospholipase C.
Each sub-class, purified by TLC, is analyzed by HPLC.
DISPERSIVE LIQUID-LIQUID MICROEXTRACTION
Lire la suiteDevenez membre et participez au développement de la Lipidomique au XXIème siècle.
S'inscrire